PickFOOD
Case Study · UX UI Design
Designing a social commerce app that connects local farmers markets with community-driven food discovery.
#UX Research #UI/UX #Prototyping #Social Commerce #Case Study
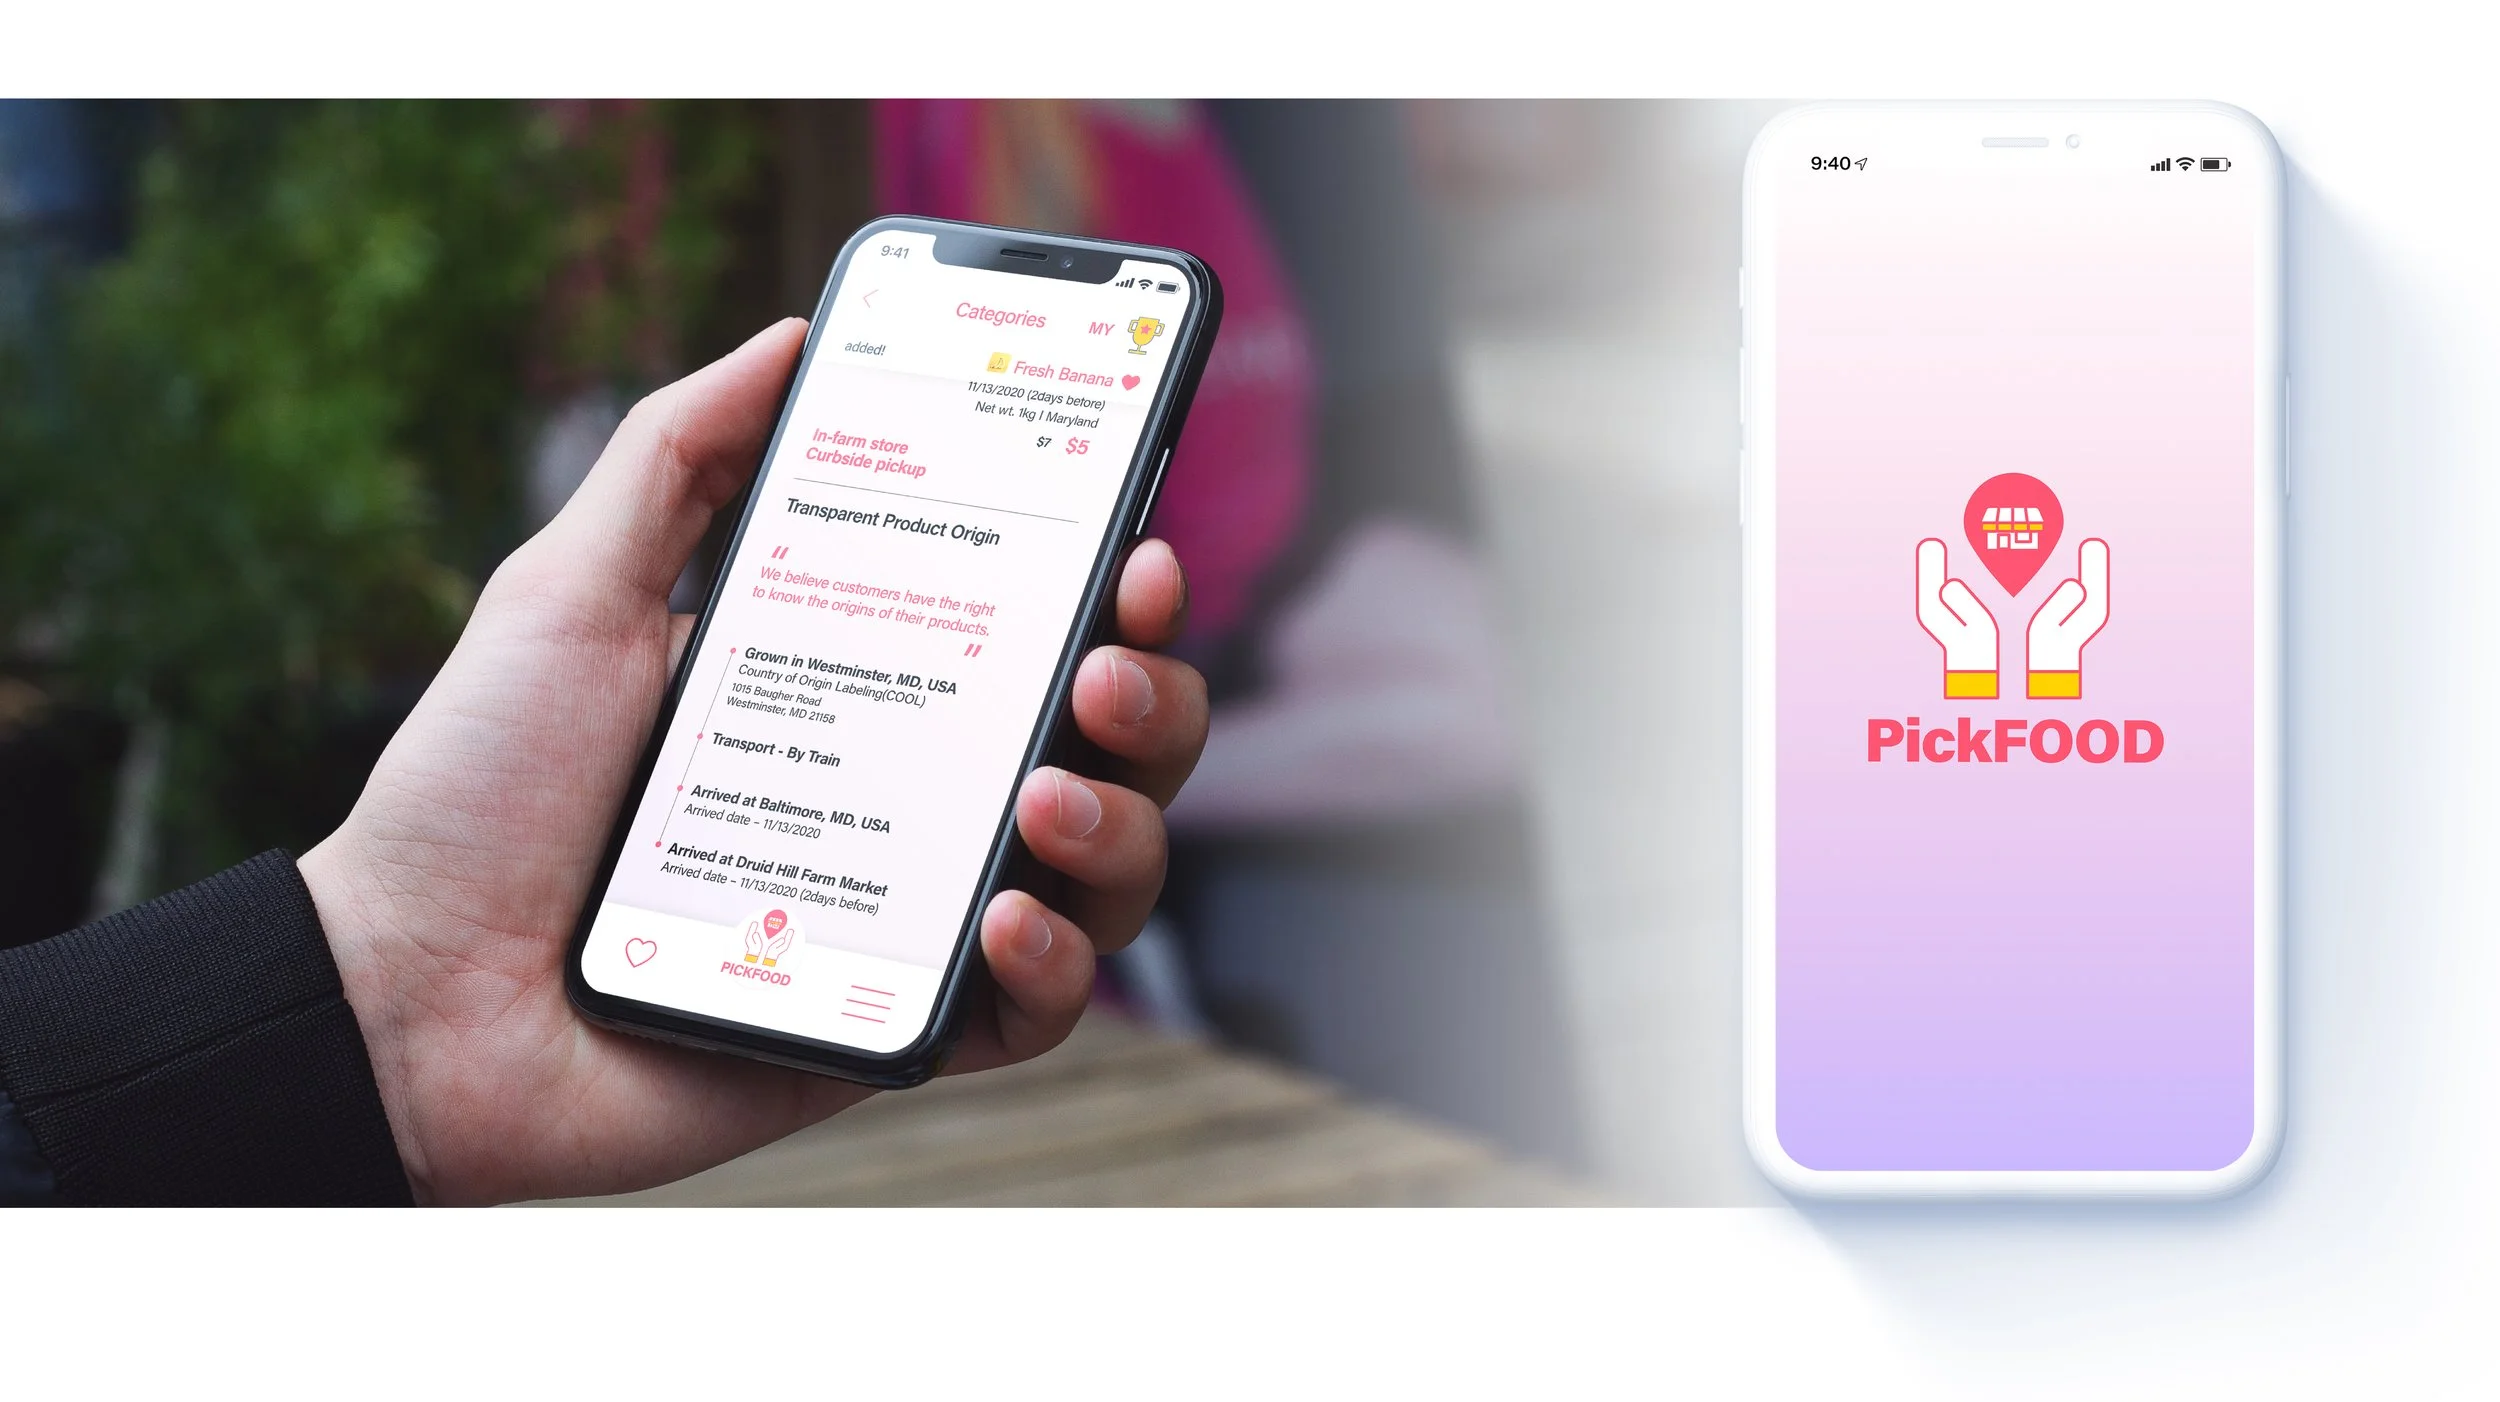
PickFOOD is a social commerce platform that bridges local farmers markets and consumers — enabling real-time food discovery, transparent product origins, and community engagement through integrated social features.
Consumer behaviors are shifting toward local, transparent, and community-driven food experiences.
Success Metrics
The product succeeds when:
Local farmers markets see increased visibility and engagement from nearby users.
Users find relevant, personalized food options that motivate repeat discovery and purchase.
The experience bridges online and offline — turning social engagement into real-world local commerce activity.
Final Design
Design Process
01 THE BIG SHIFT
Shifting Consumer Behavior and the Rise of Local Commerce
As digital habits evolved, consumers began prioritizing transparency, locality, and community connection in how they discover and purchase food. Local farmers markets gained renewed relevance — but lacked the digital infrastructure to meet users where they were.
02 RESEARCH
Using Human-Centered Methodology to Perform Both Qualitative and Quantitative Field Research
For this project, I used human-centered methodologies to perform qualitative and quantitative field research on subcultures or special interest groups. Following this research, I critically executed the culture to build a subjective narrative of the social such as personas, user narratives, and infographics based on the collected data.
1) 30 Online Questionnaire
To find before and after covid19 consumer behavior, I created a questionnaire including the changing route of buying methods, how often they use the chosen buying method, what items they shop for, and any purchasing experiences.
3) 10 Interviews
To get a more detailed reflection on the purchasing experiences, I decided to do a 1:1 in-person zoom interview with 10 users. I found some of the most critical takeaways.
2) Data Analysis in Infographics
After I got the responses from 30 participants, I created the infographic design to understand the survey results clearly and determine insights.
According to the survey results,
73.3 %of Users usually shop online.
65% of Users usually purchase food.
83.3% of Users prefer the local brand because of the “proximity, accessibility, fast delivery, low shipping costs, and product origin.”
(Out of 100% / Based on all generations XYZ)
4) 3 User Personas
Based on the insights from research, I synthesized and developed a user profile highlighting user needs and goals and created user stories to understand major scenarios.
User Personas
Key Takeaways
Local food commerce is shifting online — and consumers expect this to become their default shopping behavior, not a temporary habit.
Mobile-first experience is non-negotiable — the primary driver of online shopping adoption is seamless usability on mobile devices.
Social proof drives discovery — users rely on peer recommendations and social media to find and trust new food brands and local markets.
03 NEW DISCOVERY
Identifying the Right User — and the Right Opportunity
Research revealed that Millennials showed the strongest shift toward local food purchasing — actively seeking transparency, freshness, and community connection in how they shop. With limited digital solutions serving this behavior, the opportunity was clear: design an experience that bridges local farmers markets with the social, mobile-first habits of this audience.
Speculation
Millennials are highly engaged with social platforms and digital commerce — making them the ideal early adopters for a social commerce experience built around local food discovery and community participation.
Competitive Audit
I audited the leading local food service apps – including Farm to People, Otipy, Get Farm Fresh, Farmstand, Seasons, Fresh Food Finder, and Harvest – to identify gaps in how existing solutions serve local food discovery. The analysis revealed key limitations around real-time availability, product transparency, and community engagement, which directly informed PickFOOD’s core differentiators.
Food Service App Competitive Aduit
Key Takeaways
Users wanted community and connection — not just a transactional app, but a way to feel connected to their local neighborhood and food community.
Users needed real-time food availability — freshness and timing are critical; delayed or inaccurate information breaks trust immediately.
Users needed a reason to come back — without clear motivation and tangible benefits, engagement drops after the first use.
04 IDEATION
Designing Around Three Core User Needs
Drawing from research and behavioral insights, I defined PickFOOD's core value proposition around three key interaction moments — each addressing a real friction point in how users discover, trust, and engage with local food.
Local Farmers Market Nearest Users
Connecting users to the nearest farmers markets with two pickup options — curbside or in-farm store — with discounts that reward direct local shopping. Transparent freshness indicators give users confidence in what they're buying, with a full refund guarantee if the product doesn't meet expectations.
Real-Time Food Alert Service
An alert system that surfaces fresh food availability as it happens — including product origin, location, and today's freshest picks at nearby farmers markets.

PickFOOD #Challenge
A monthly community challenge that turns local food discovery into a social experience. The most-cited food wins the month — and users can purchase it at 15% off across all PickFOOD partner markets the following month.
05 EXPLORATION
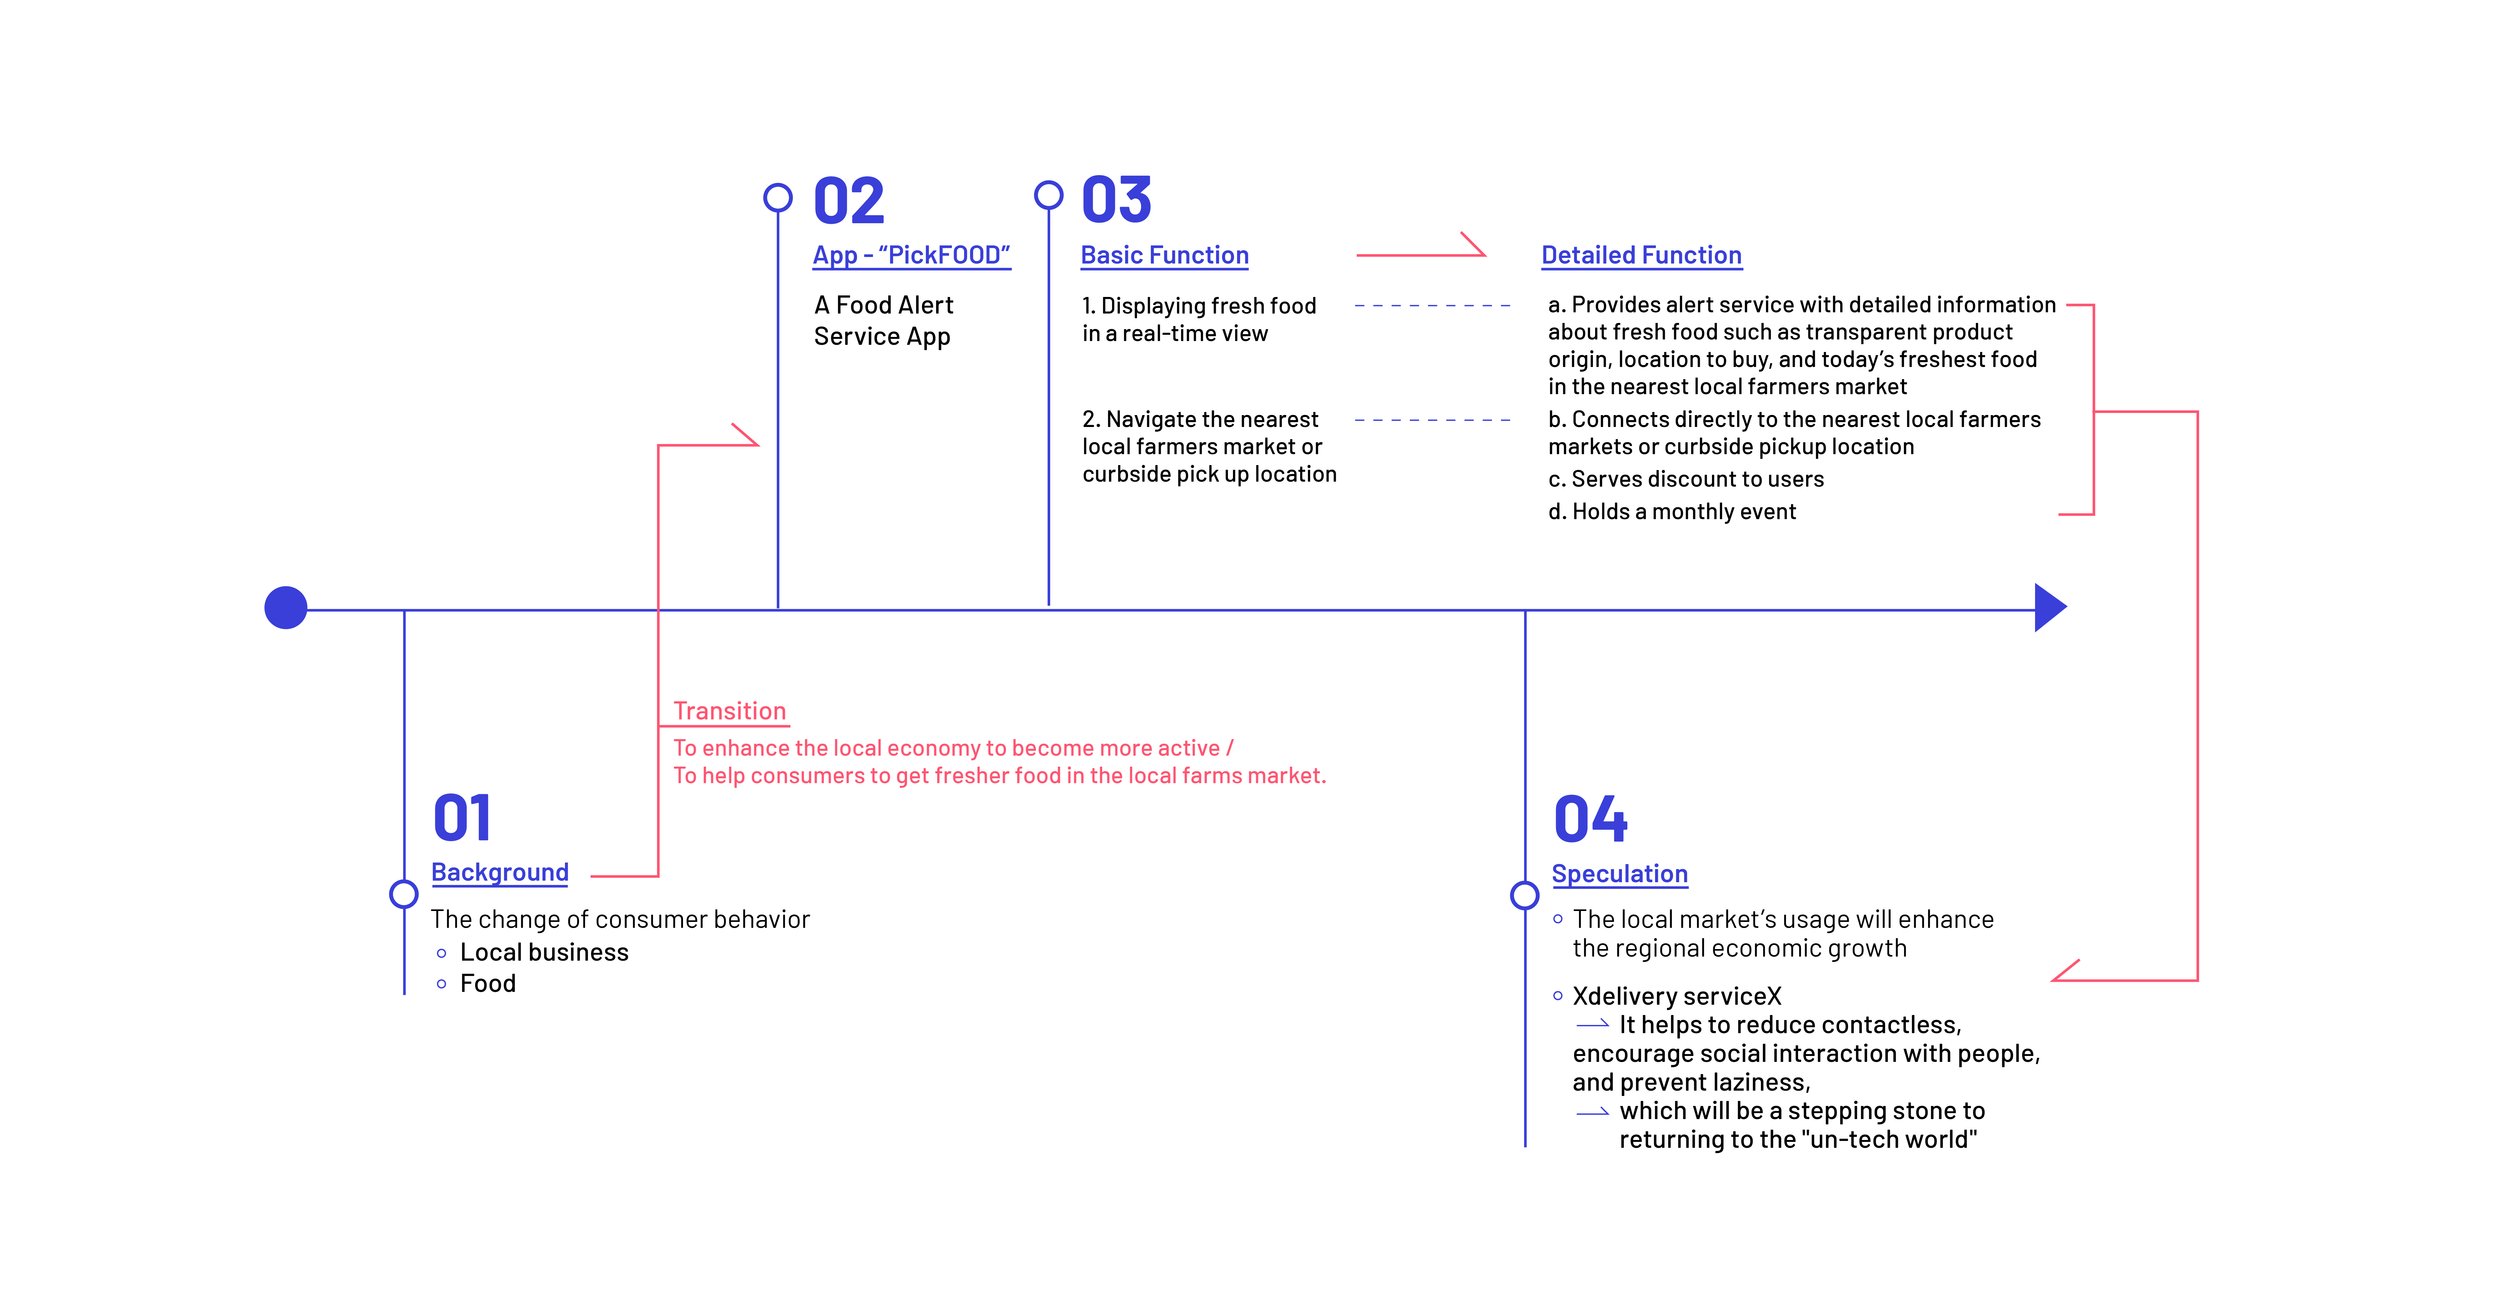
Mapping the User Journey Around Core Features
I created a user journey map to visualize how users move through the app's three key features — from discovering nearby markets, to receiving real-time food alerts, to participating in monthly challenges. The goal was to ensure each touchpoint delivered timely, accurate, and contextually relevant information that made local food shopping feel effortless.
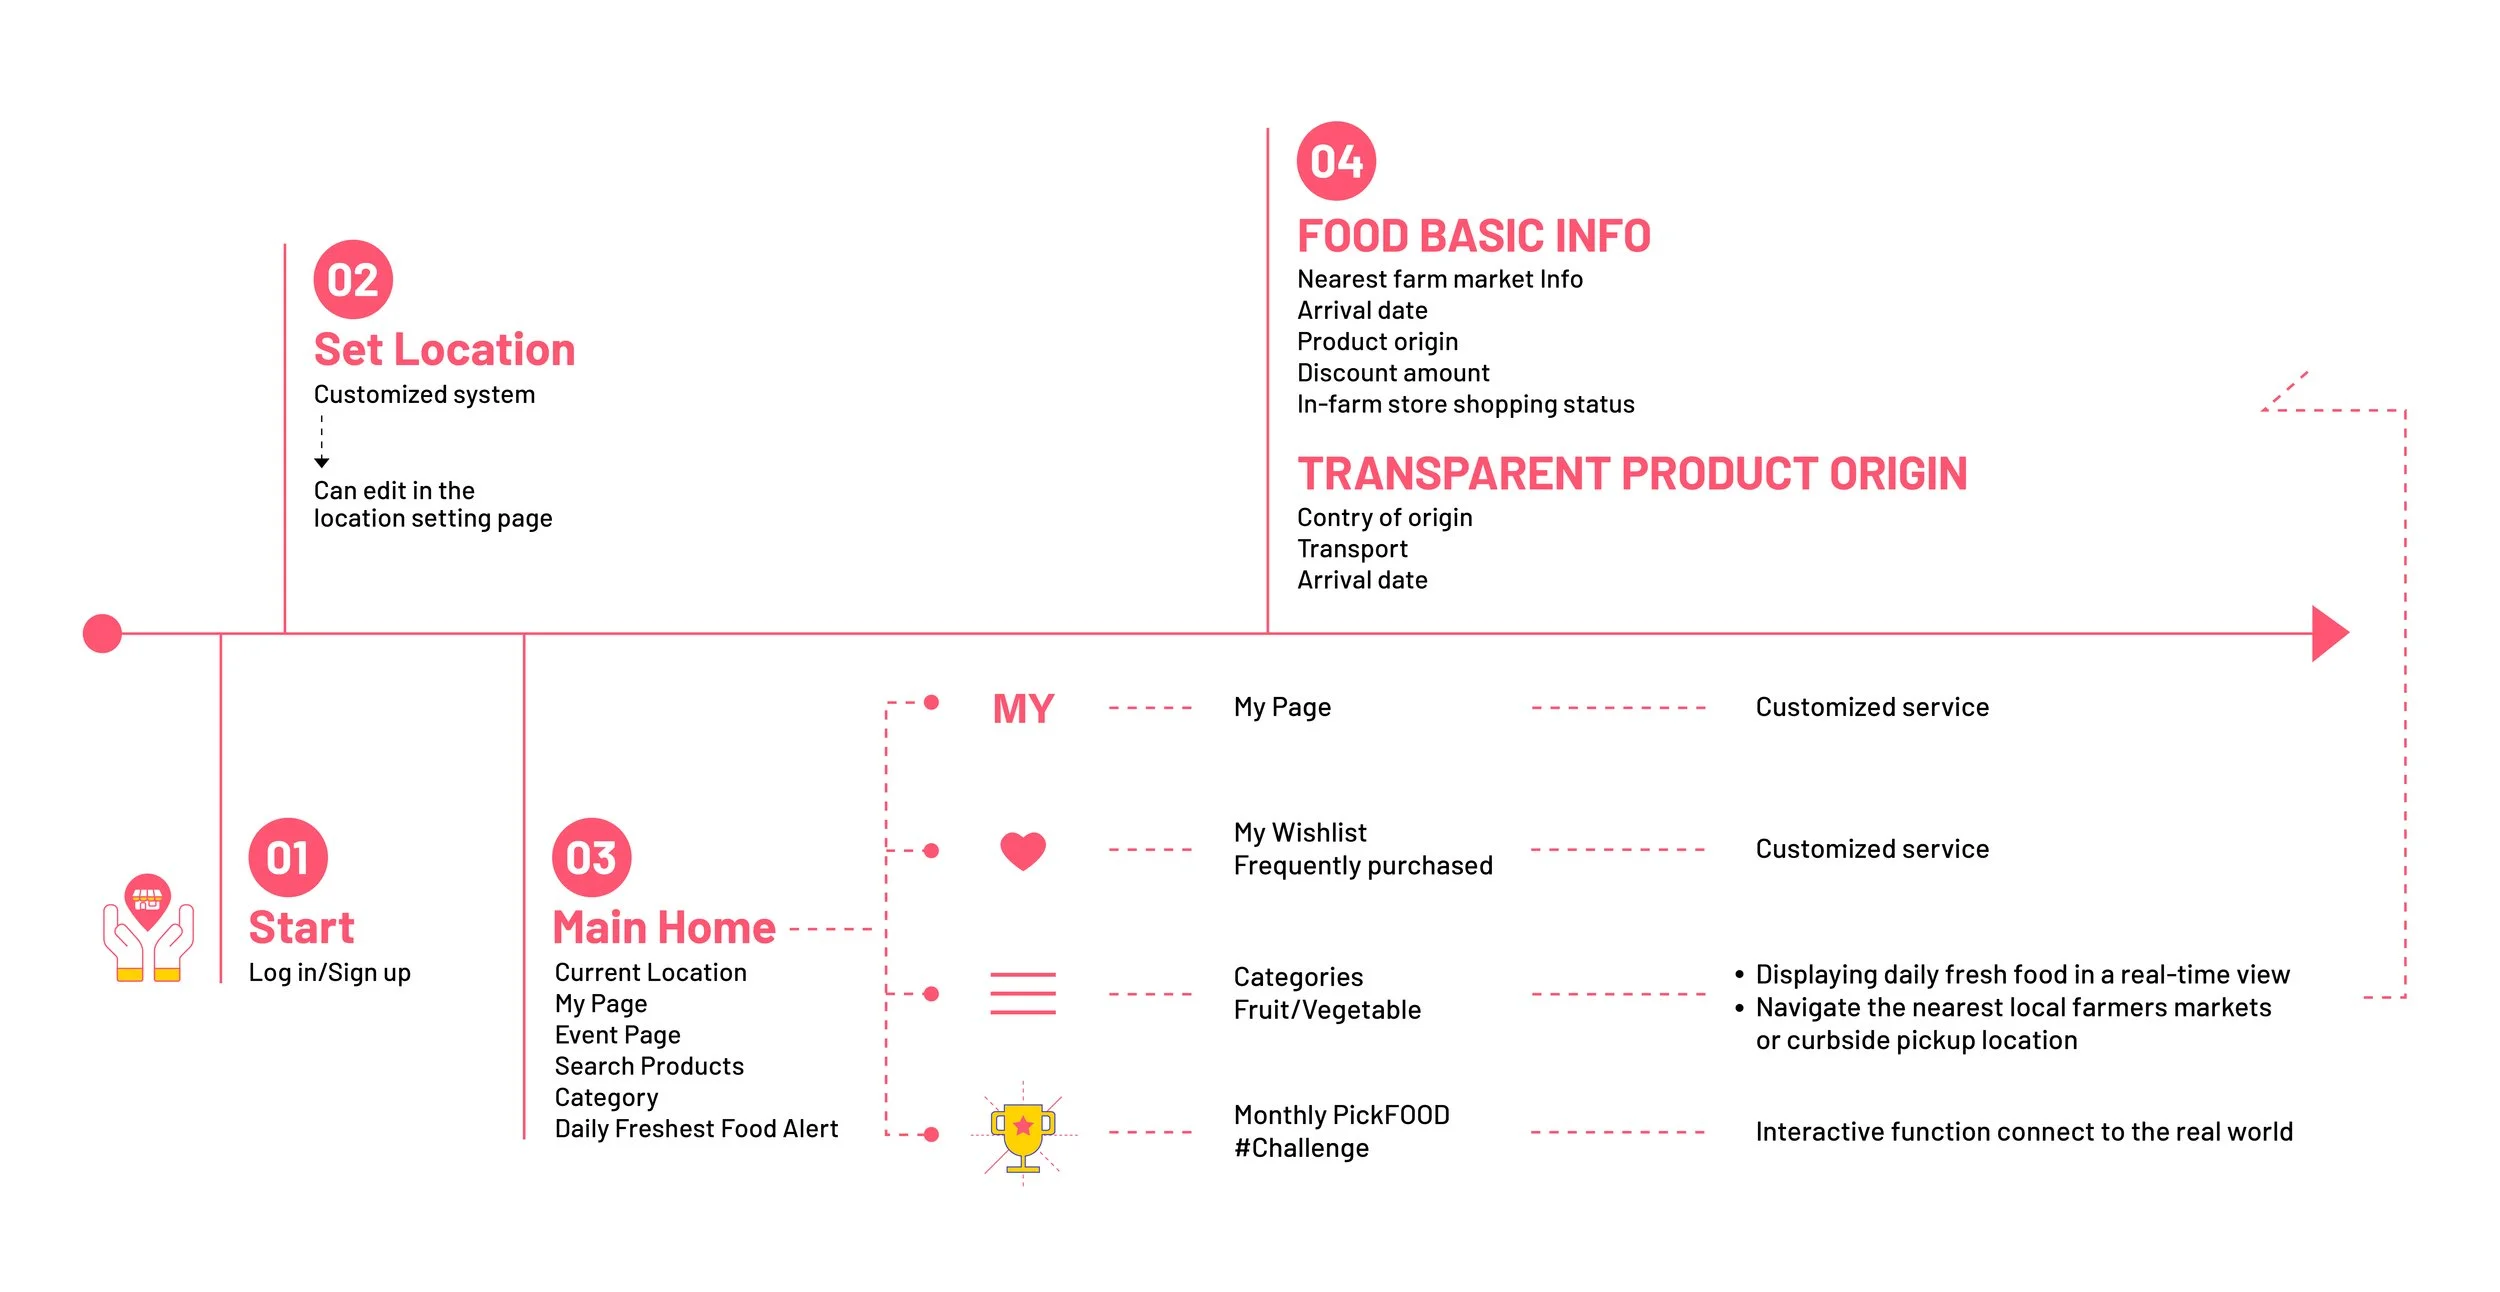
User Journey Map
User Impact Journey Map
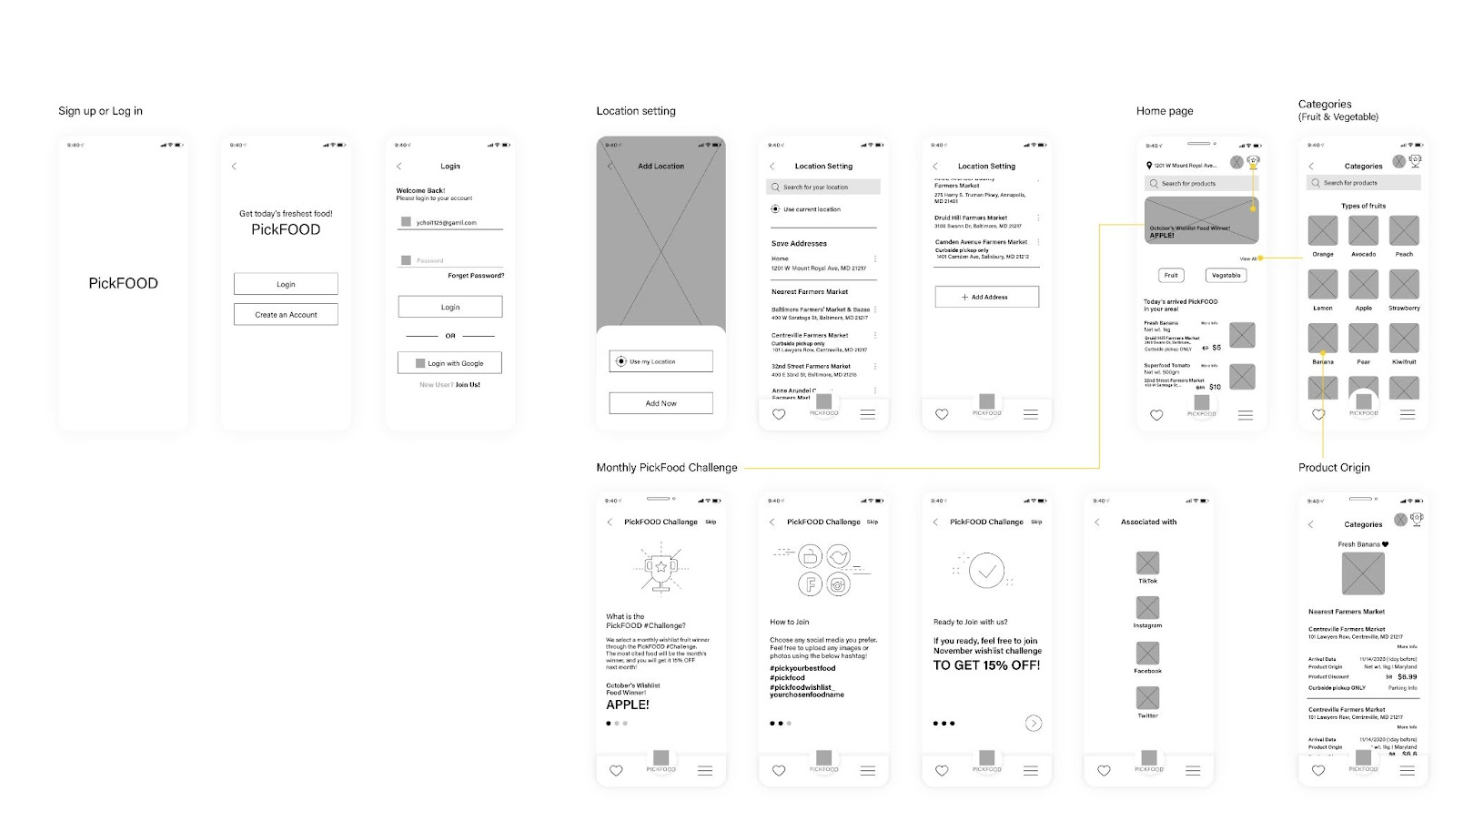
Initial Wireframe
06 DESIGN ITERATIONS — User Testing
Low – Mid Fidelity User Testing to obtain potential improvement.
I created four tasks to do user testing with wireframes. For this process, I printed each screen of the app, helping users to follow the flow easily. Design iterations helped me to understand the most significant thing users consider when they interact with the app.
Tasks
1) You want to add your location.
2) You want to get the selected product's origin.
3) You want to find the information about the hashtag event.
4) You want to upload your purchasing item and join the event on social media.
Selected Top-level requirement screens
to do a user testing
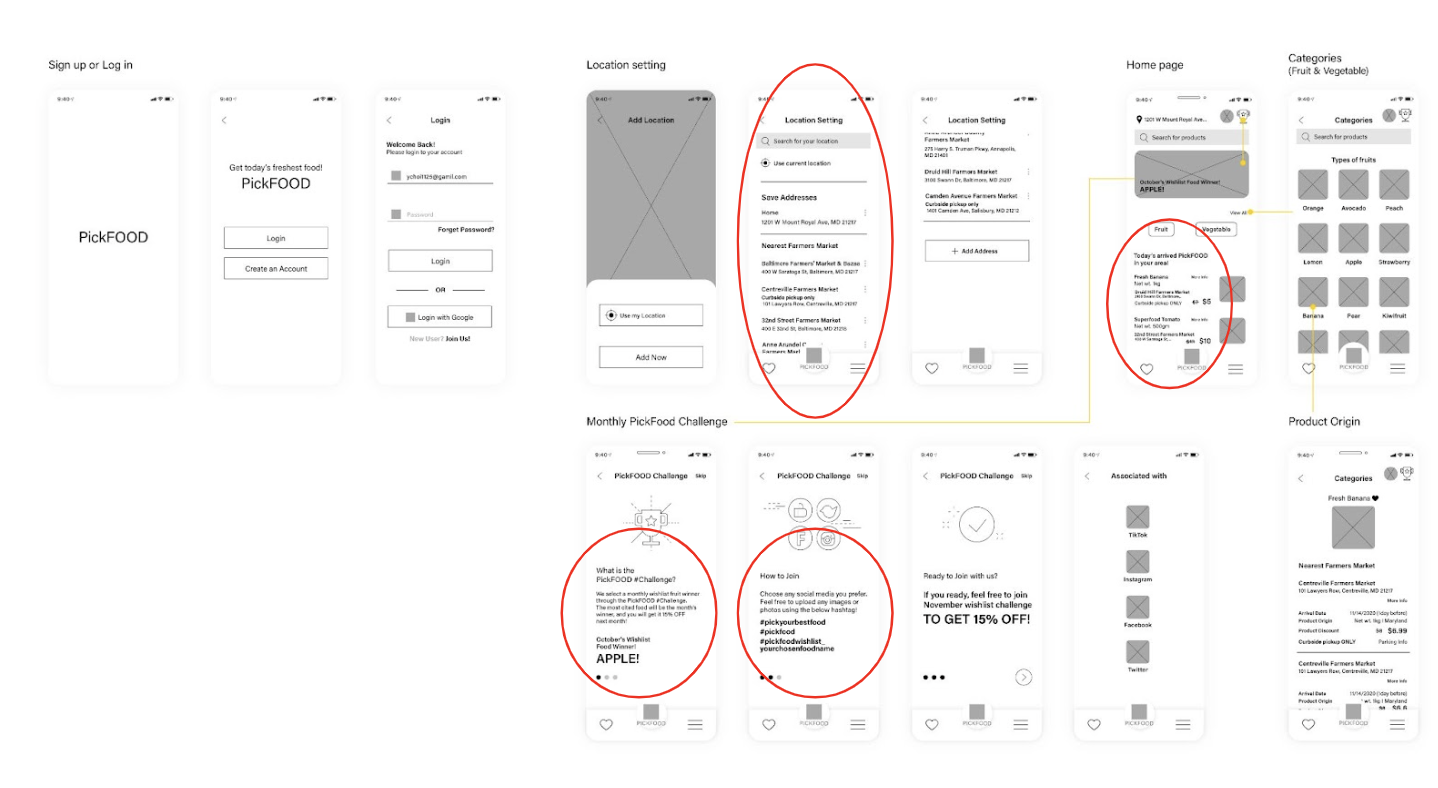
Marked places where the problems occurs
Through the user testing with five users, I received positive comments as well as critical feedback. Amongst the many user feedbacks, the single takeaway voiced by every single participant was that there is "too much content and texts in one view, which makes it hard to decide what to focus on."
06 DESIGN ITERATIONS
Refining the Experience Through Iterative Testing
Based on user testing feedback, I iterated on layout, typography, visual hierarchy, and logo design — refining each element until the experience felt intuitive, consistent, and aligned with how users naturally navigate the app.
1) Modifying the right font size for readability.
2) Placing relevant images to get users' attention.
3) Adding accurate sentences in the main event box on the home screen.
Developed Wireframe
07 FINAL DESIGN
Designing for Clarity, Community, and Trust
Building on research insights, I developed a visual identity and interaction system that reflects PickFOOD's core values — freshness, transparency, and local community connection. I redesigned the visual language and reward system to create a more cohesive brand experience, and refined the final prototype to encourage users to actively explore local markets, engage with their community, and support nearby businesses through an intuitive social commerce experience.
Design Style Guide
Final Prototype
Monthly PickFOOD #hashtag Challenge in Social Media
Notification Screens
08 THE IMPACT
Strengthening Local Commerce Through Connected Experiences
PickFOOD creates a direct link between local food producers and consumers — making fresh, locally sourced food more discoverable, accessible, and trustworthy. By connecting farmers markets with social commerce features, the app drives meaningful engagement that supports regional economic growth while giving users more agency over where their food comes from.
09 POTENTIAL IMPROVEMENT IN THE NEXT STEP
What I'd Explore Next
Deepen product origin visualization: The transparency features have strong potential — with more refined data visualization, users could understand their food's journey at a glance, reducing information overload while building trust.
Expand and iterate on usability testing: Initial validation confirmed core flows, but deeper qualitative research would surface edge cases — particularly around the social commerce integration and farmers market onboarding experience.
Measure long-term UX success: Beyond usability metrics, tracking repeat engagement, local market conversion rates, and social sharing behavior would validate whether PickFOOD drives sustained behavior change — not just initial adoption.